Summary: Latitude vs. X
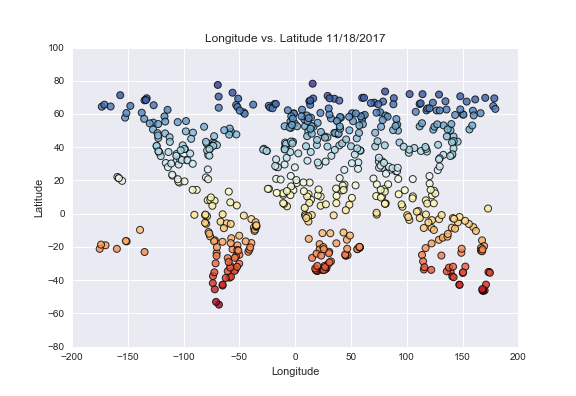
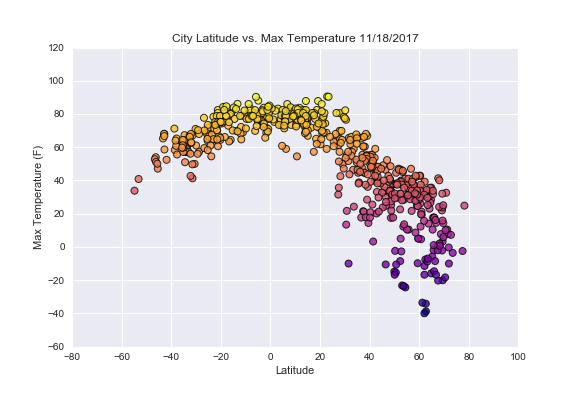
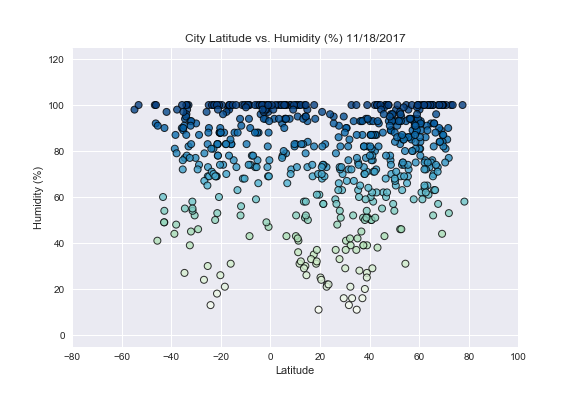
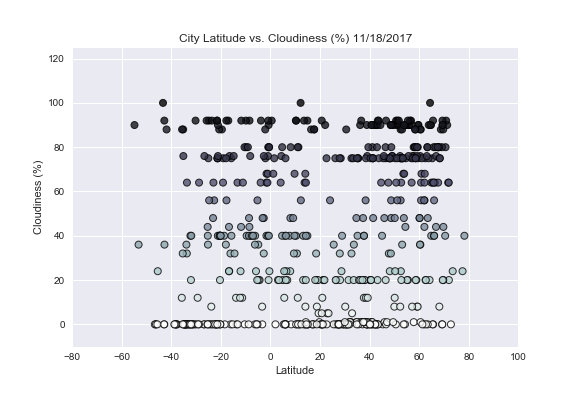
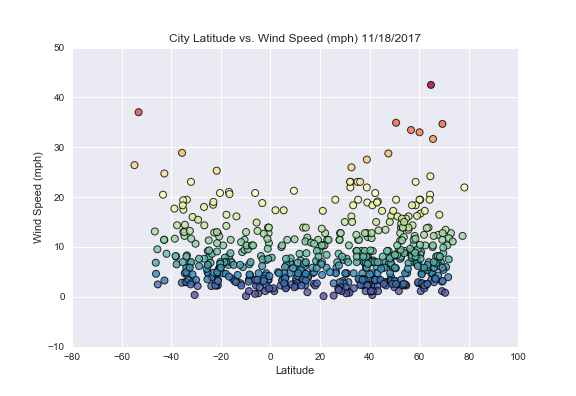
The purpose of this project was analyze the weather the closer it is to the equator. Using Jupyter Notebook and the OpenWeatherMap API I retrieved 500+ random latitudes and longitudes. Using the Python library, CityPy, I iterated through these latitudes and longitudes to find the nearest city. To perform data analysis, I used Pandas and Matplotlib, to generate a series of scatter plots to visually show the relationship between latitude and temperature, humidity, cloudiness, and wind speed.
Visualizations