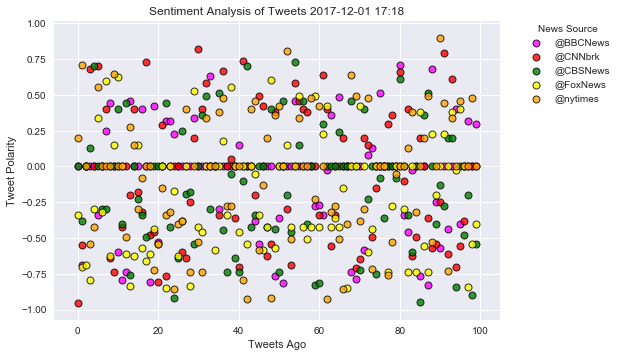
 I'm a research-minded scientist who enjoys solving problems through data analytics and visualization.
In my professional career, I apply critical thinking and logical reasoning, and practice good time management,
organization, and communication.
I'm a research-minded scientist who enjoys solving problems through data analytics and visualization.
In my professional career, I apply critical thinking and logical reasoning, and practice good time management,
organization, and communication.
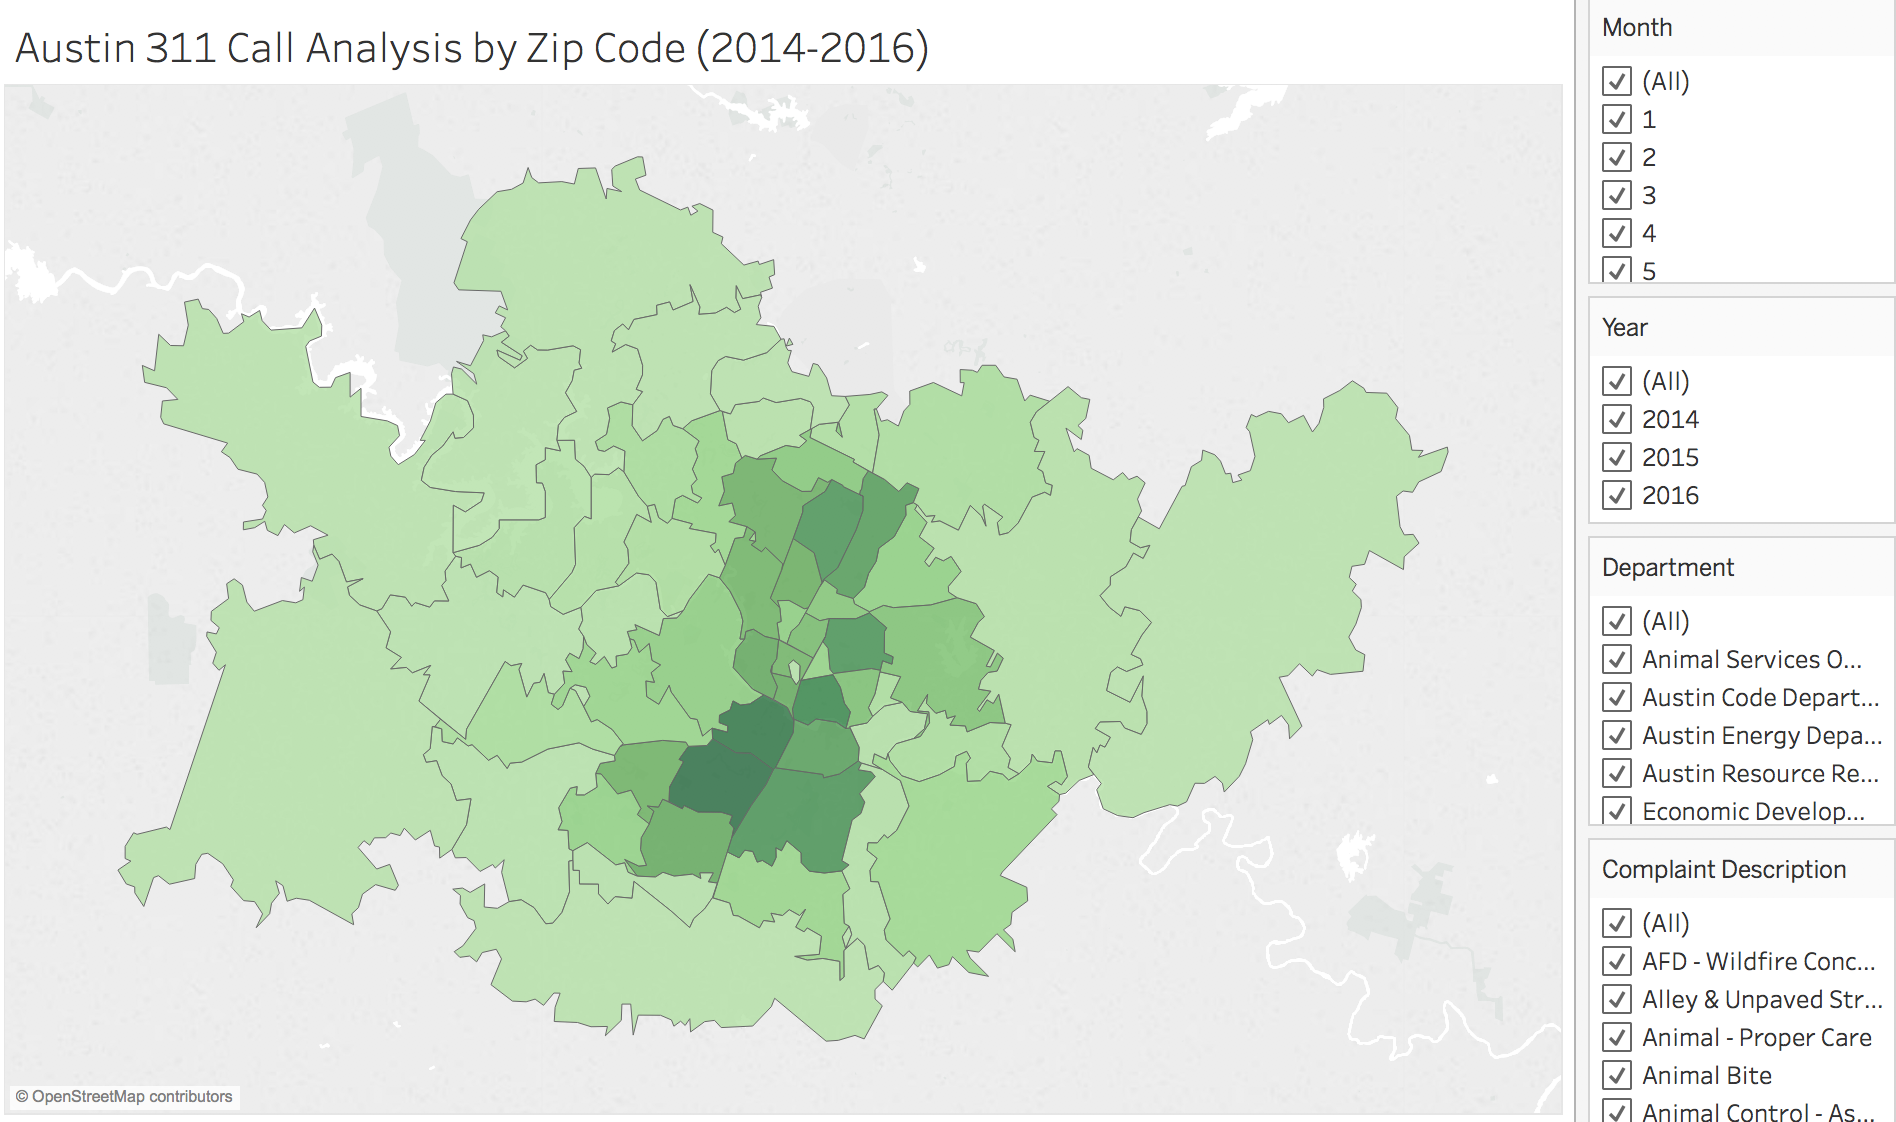
Currently, I am a Teaching Assistant and Senior Tutor for Trilogy Education Services - Data Analytics and Visualization certification course, and web specialist for the Austin Community College Biology Department's website.
I earned my Data Analytics and Visualization Certification from Trilogy Education Services through UT Austin in April 2018, and my Software Testing Certification in May 2016 from Austin Community College.